Visualization - Subplots
IBM Data Science Specialization: Subplots


Subplots
Often times we might want to plot multiple plots within the same figure. For example, we might want to perform a side by side comparison of the box plot with the line plot of China and India's immigration.
To visualize multiple plots together, we can create a figure (overall canvas) and divide it into subplots, each containing a plot. With subplots, we usually work with the artist layer instead of the scripting layer.
Typical syntax is :
fig = plt.figure()
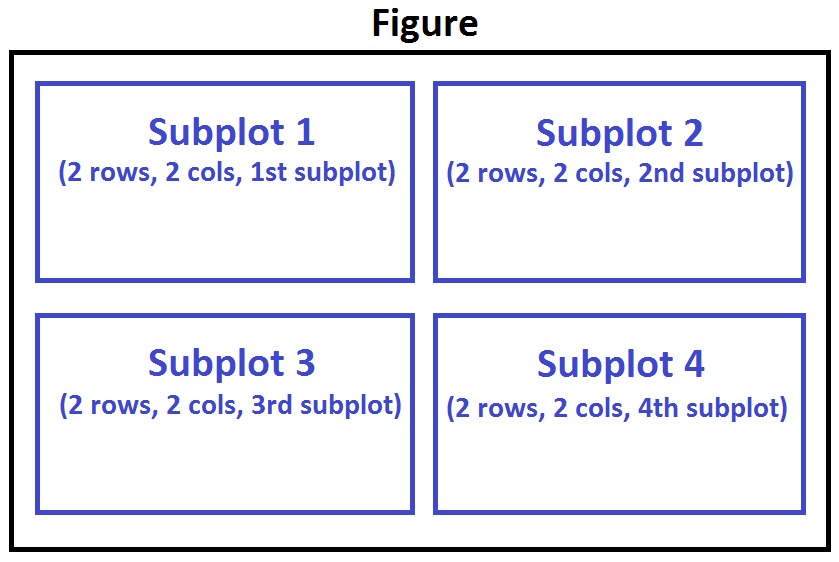
ax = fig.add_subplot(nrows, ncols, plot_number)
Where
nrowsandncolsare used to notionally split the figure into (nrows*ncols) sub-axes,plot_numberis used to identify the particular subplot that this function is to create within the notional grid.plot_numberstarts at 1, increments across rows first and has a maximum ofnrows*ncolsas shown below.
%%capture
!pip3 install xlrd
import matplotlib.pyplot as plt
import pandas as pd
df_can = pd.read_excel(
    './data/ibm/canada.xlsx',
    sheet_name='Canada by Citizenship',
    skiprows=range(20),
    skipfooter=2
)
df_can.columns = list(map(lambda x: str(x), df_can.columns))
drops = [
    'AREA',
    'REG',
    'DEV',
    'Type',
    'Coverage'
]
df_can.drop(columns=drops, inplace=True)
columns = {
    'OdName': 'Country',
    'AreaName': 'Continent',
    'RegName': 'Region'
}

df_can.rename(columns=columns, inplace=True)
df_can.set_index('Country', inplace=True)
df_can['Total'] = df_can.sum(axis=1)
years = list(map(str, range(1980, 2014)))
df_ci = df_can.loc[['China', 'India'], years].transpose()
fig = plt.figure()

ax0 = fig.add_subplot(1, 2, 1)
ax1 = fig.add_subplot(1, 2, 2)

df_ci.plot(kind='box', color='blue', vert=False, figsize=(20, 6), ax=ax0)
ax0.set_title('Box Plots of Immigrants from China and India (1980 - 2013)')
ax0.set_xlabel('Number of Immigrants')
ax0.set_ylabel('Countries')

df_ci.plot(kind='line', figsize=(20, 6), ax=ax1)
ax1.set_title ('Line Plots of Immigrants from China and India (1980 - 2013)')
ax1.set_ylabel('Number of Immigrants')
ax1.set_xlabel('Years')

plt.show()

Tip regarding subplot convention
In the case when nrows, ncols, and plot_number are all less than 10, a convenience exists such that the a 3 digit number can be given instead, where the hundreds represent nrows, the tens represent ncols and the units represent plot_number. For instance,
subplot(211) == subplot(2, 1, 1)
produces a subaxes in a figure which represents the top plot (i.e. the first) in a 2 rows by 1 column notional grid (no grid actually exists, but conceptually this is how the returned subplot has been positioned).